The effect various light wavelengths have on the structure and shape of a plant is called photomorphogenesis.
And it’s about more than just red and blue light. UV light, far red light and even green and orange light affect plant growth!
HPS Spectra
HPS lighting emits a lighting spectrum dominant in far red, red and yellow wavelengths of light. A red-dominant spectrum like this can cause plants to grow taller and develop thinner stems and leaves as compared to natural sunlight. Natural light is thought to be more “balanced” due to more ultraviolet (UV), blue and green wavelengths.
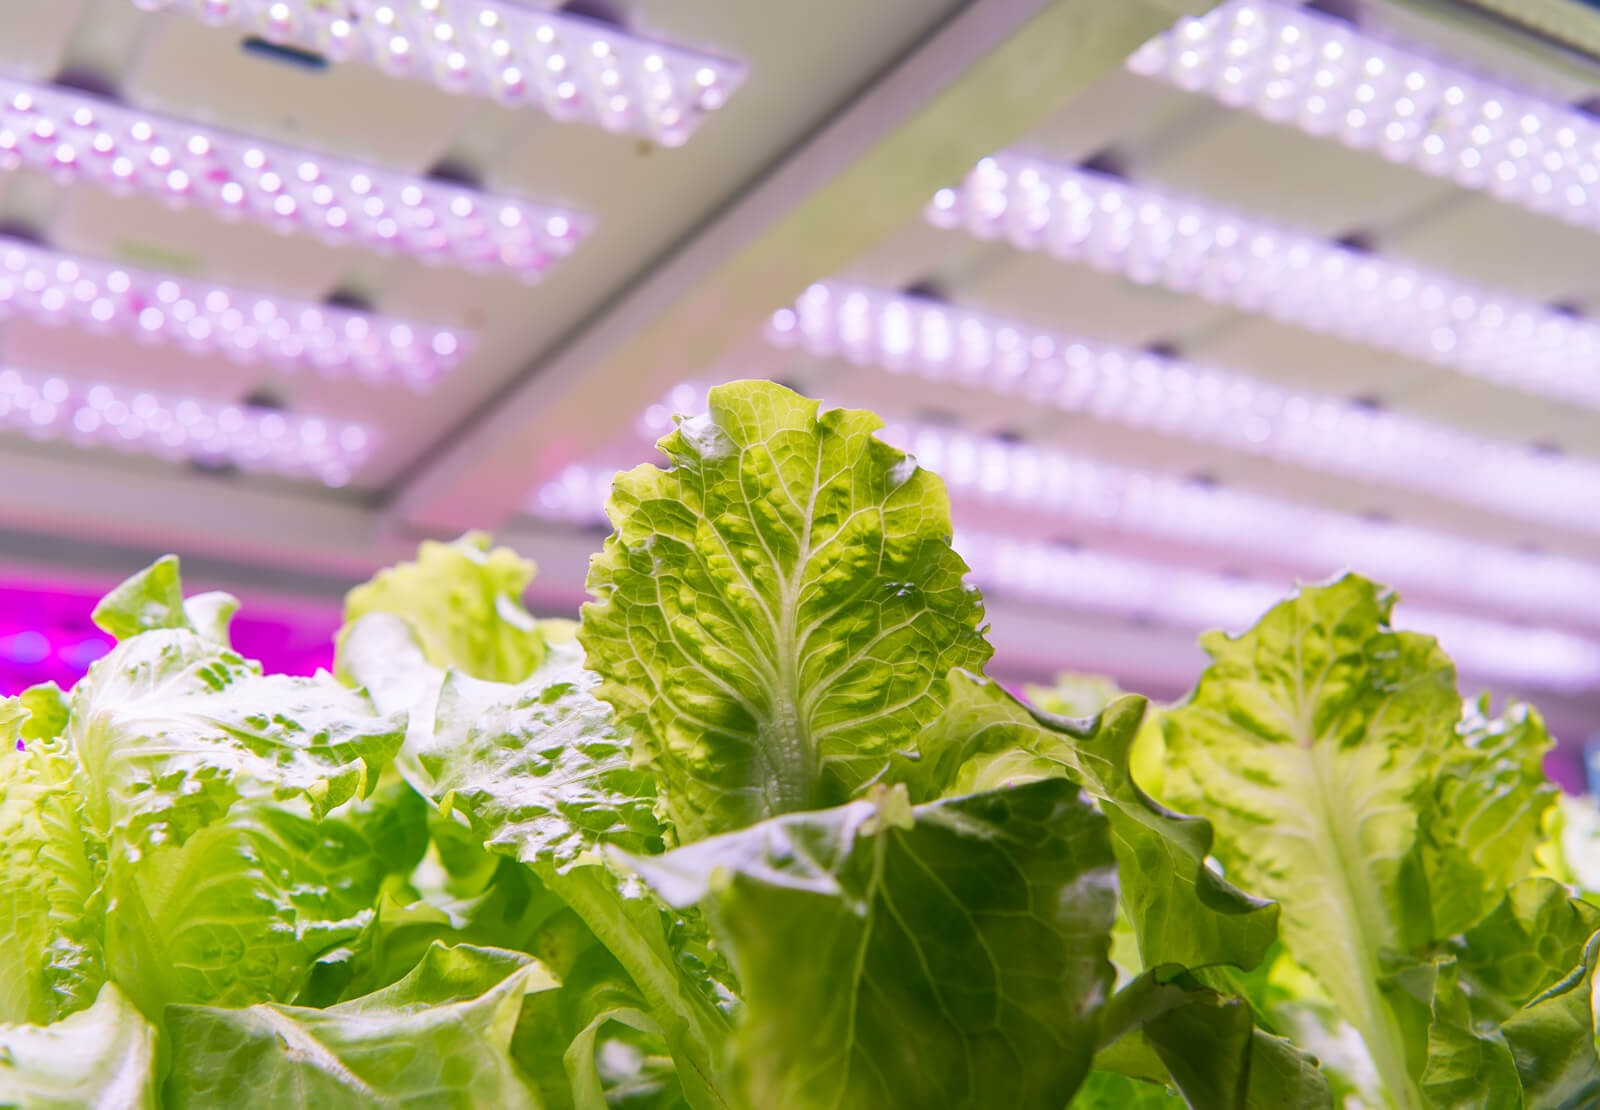
LED Spectra
Rich in blue, green, yellow and red light, LEDs can provide a more balanced lighting spectrum than HPS. Crops grown under the balanced spectrum of an LED exhibit growth patterns more true to crops grown under natural sunlight than those grown with HPS lighting. The result is crops that are stockier, with thick stems and expansive, broad leaves.
Differences in Growth
This makes sense from an ecological perspective, as plants have evolved to respond to natural light. Plants growing out in the open (more blue light and red light, minimal far red light), develop a more compact, stocky habit. On the other hand, plants grown under a plant canopy (low blue and red light and high far red light), such as in a forest, will stretch and be somewhat spindly, often said to be “seeking” light.
It’s helpful to keep these differences in mind when planning a transition from HPS to LED fixtures.

Take Advantage of Increased Light Intensity
Remember how HPS fixtures emit significant amounts of radiant heat? That heat prevents growers from placing their crops too close to HPS fixtures, which generally limits the maximum light intensity a plant will receive, compared to LED fixtures.
Because LEDs emit less radiant heat than HPS, cultivators can increase the PPFD (photosynthetically active photon flux density, or the amount of plant-usable light, measured in photons) to higher levels than recommended when using HPS.
This is a game-changer for growers. It means cultivators can now help deliver more photons on-target without overheating their crops, helping push maximum growth like never before.
A few things to keep in mind when using LED:
- Dialing in your environment (temperature, humidity, CO2, watering and nutrients) is critical to helping your crops make use of the extra photons.
- More is not always better. If crops cannot effectively make use of the extra photons, increased light energy can cause oxidative damage to the photosynthetic machinery of your crops, leading to photoinhibition, or a reduction in the photosynthetic capacity of a plant in response to excess light energy.
- Optimize your growing parameters for growing with LED. This can help avoid metabolic bottlenecks that lead to photoinhibition, helping promote rapid, balanced growth.
- Monitor light intensity. Because LEDs are often mounted much closer to plant canopies than HPS, we recommend using a PAR (photosynthetically active radiation) meter to measure PPFD at the canopy and help minimize overexposure.

LED Cultivation Setpoints
Suggested LED setpoints for crop stage-appropriate PPFD levels
Scroll for more →
| Mothers | Propagation Week 1 | Propagation Week 2 | Propagation Week 3 | Veg Week 1-2 | Veg Week 2-4 | Flower Week 1 | Flower Week 2 | Flower Week 3-5 | Flower Week 6 | Flower Week 7 | Flower Week 8 | Flush Week 9 | |
| Lighting Spectrum | Broad Spectrum | Broad Spectrum | Broad Spectrum | Broad Spectrum | Broad Spectrum | Broad Spectrum | Broad Spectrum | Broad Spectrum | Broad Spectrum | Broad Spectrum | Broad Spectrum | Broad Spectrum | Broad Spectrum |
| Photoperiod (hours) | 18 | 18 | 18 | 18 | 18 | 18 | 12 | 12 | 12 | 12 | 12 | 12 | 12 |
| Lighting Intensity (µmols/m2/s | 500 | 150 | 250 | 250 | 400 | 550 | 650 | 800 | 1000-1500* | 1000-1200* | 800-1000* | 800 | 700 |
| CO2 ppm, Day | 800 | 400 | 600 | 600 | 800 | 800 | 1000 | 1200 | 1200 | 1200 | 800 | 600 | 400 |
| CO2 ppm, Night | 400 | 400 | 400 | 400 | 400 | 400 | 400 | 400 | 400 | 400 | 400 | 400 | 400 |
| Day Temp | 85 | 75 | 75 | 75 | 85 | 85 | 85 | 85 | 83 | 80 | 78 | 75 | 72 |
| Night Temp | 75 | 75 | 75 | 75 | 75 | 75 | 75 | 75 | 75 | 72 | 72 | 68 | 65 |
| Day RH | 75 | 80 | 80 | 70 | 75 | 75 | 75 | 75 | 70 | 65 | 60 | 55 | 50 |
| Night RH | 65 | 80 | 80 | 70 | 65 | 65 | 65 | 65 | 65 | 55 | 50 | 45 | 45 |
| Leaching Fraction | 5%-20% | n/a | n/a | n/a | 5%-20% | 5%-20% | 5%-20% | 5%-20% | 5%-20% | 5%-20% | 5%-20% | 5%-20% | 20%+ |
| *PPFD @ Flower Weeks 3-5 | PPFD @ Flower Week 6 | PPFD @ Flower Week 7 | Crop Index |
| 1000 | 1000 | 800 | All strains |
| 1000-1200 | 1200 | 1000 | Most strains |
| 1200-1500 | x | x | Test first, strain dependent |
Remember to check your PPFD levels with your PAR meter before moving in your young plants!
Continue learning with our next tip ⟶